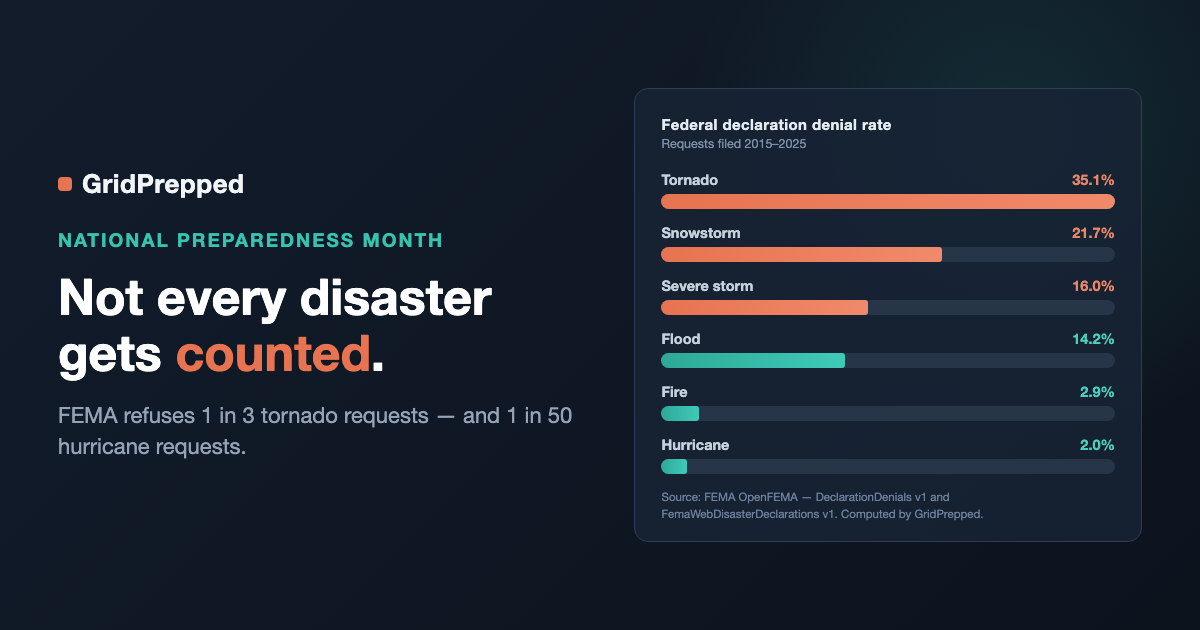
FEMA Turned Down 1 in 3 Tornado Requests — and 1 in 50 Hurricane Requests
FEMA data, 2015-2025: 35% of tornado declaration requests were denied vs 2% of hurricane requests. Why ordinary storms fall through, and what to do.
September is National Preparedness Month, which means your feed is about to fill up with the same advice it fills up with every year. Build a kit. Make a plan. Know your evacuation route.
None of that is wrong. But it all rests on an assumption nobody says out loud: that if something big enough happens, the federal government shows up. So I went looking for the cases where it didn't — and found something more interesting than I expected.
FEMA publishes its rejections. Almost nobody reads them.
Every federal disaster declaration starts with a governor formally asking. FEMA maintains a public dataset of the requests that were refused — DeclarationDenials, 1,304 records of what the agency calls a "turndown."
That file is heavily weighted toward the past: 39% of it is from the 1970s alone. So an all-time count tells you nothing about today. I windowed it to requests filed between 2015 and 2025 — 154 turndowns — and compared them against the 1,484 declarations FEMA approved over the same stretch. Roughly one in ten formal requests gets refused.
The overall rate isn't the story. The breakdown is.
| Disaster type | Denied | Approved | Denial rate |
|---|---|---|---|
| Tornado | 13 | 24 | 35.1% |
| Snowstorm | 5 | 18 | 21.7% |
| Severe storm | 52 | 273 | 16.0% |
| Flood | 28 | 169 | 14.2% |
| Fire | 17 | 568 | 2.9% |
| Hurricane | 3 | 149 | 2.0% |
A hurricane request is approved about 49 times out of 50. A tornado request is refused better than one time in three. Same agency, same paperwork, same eleven-year window — and roughly a seventeen-fold difference in the odds, depending entirely on what kind of weather hit you.
Two honest caveats before anyone builds a policy argument on that fire number: fire's low rate is inflated by Fire Management Assistance Grants, which are fast, small, and easy to qualify for compared to a full major-disaster declaration. And states can appeal a turndown, so a denial isn't always the last word. The tornado-versus-hurricane gap survives both caveats intact.
Why the ordinary storm is the one that gets refused
This isn't FEMA being arbitrary. It's arithmetic.
Public Assistance eligibility keys off a per-capita damage indicator. For fiscal 2025, a state had to show damage of at least $1.89 per resident statewide, and $4.72 per resident in an affected county, per the Congressional Research Service. Those are per-*person* numbers, so the bar scales with population.
A hurricane clears that bar without trying, because it damages entire regions at once. A tornado does not. An EF3 can obliterate four hundred homes along a two-mile track and still not move a statewide per-capita number, because the denominator is everyone in the state. The damage is total for the people in it and statistically invisible from above.
Snowstorms land in a similar spot for a similar reason: severe, widely felt, and hard to convert into the kind of documented structural damage the formula counts.
So the federal system is calibrated for the disaster that makes national news. The disaster that hits one county on a Tuesday and never gets a name is exactly the one most likely to fall through.
What that looks like on the ground
In May 2024, four tornadoes tore through southwest Michigan, including one that lifted homes off their foundations at a mobile home park near Kalamazoo. FEMA denied the state's request, writing that the submitted damage wasn't of the magnitude needed for individual assistance. Governor Whitmer filed a formal appeal that September.
In Vermont, a July 10, 2025 rainstorm washed out roads and bridges in the Northeast Kingdom — more than $1 million in damage in the town of Sutton alone. The state's request was denied. Governor Scott appealed in November, noting that federal assessors had identified over $1.8 million in statewide damage, which he argued exceeded the Public Assistance minimum. FEMA denied the appeal too, in a February 2026 letter that gave no additional reason.
Third consecutive year of catastrophic flooding in that state. Still no.
The practical version
Nobody's household plan should assume a federal check. But the useful takeaway is narrower and more actionable than general pessimism: find out which category your address falls into, because the categories have wildly different odds.
If your dominant local hazard is hurricane, the federal machinery is very likely to engage — your planning problem is the days before it arrives and the weeks before power returns. If your dominant hazard is tornado, severe storm, or inland flooding, plan as though recovery is a household and municipal matter, because roughly one in six to one in three of those requests gets turned down outright.
That's a concrete first step, and it takes about a minute. GridPrepped's hazard lookups — tornado risk, flood zone, and hurricane risk — tell you which bucket your ZIP actually sits in. Cross that against the table above and you know how much of your recovery is realistically yours to carry.
From there it's the boring stuff that matters, which is also the stuff that decays quietly if nobody's tracking it. The supply tracker flags expirations so the water and batteries you bought in 2024 are still good when a Tuesday storm takes out your block. A saved plan is there when you need it, not stored in the head of whoever happens to be home.
National Preparedness Month is a good excuse. Start with a plan for your address — fifteen minutes, and it's free.
Sources
- FEMA OpenFEMA, DeclarationDenials v1 (1,304 records; 154 filed 2015–2025): https://www.fema.gov/openfema-data-page/declaration-denials-v1
- FEMA OpenFEMA, FemaWebDisasterDeclarations v1 (1,484 declarations, 2015–2025): https://www.fema.gov/openfema-data-page/femawebdisasterdeclarations-v1
- Congressional Research Service, "A Brief Overview of FEMA's Public Assistance Program" (FY2025 per capita indicators): https://www.congress.gov/crs-product/IF11529
- Office of Governor Gretchen Whitmer, appeal of declaration denial, September 12, 2024
- Office of Governor Phil Scott, appeal of declaration denial, November 21, 2025
Denial counts are one row per request; approvals are one row per declaration, so the ~10% figure is an approximation rather than an exact ratio. One malformed record (a Kansas row dated year 0999) was excluded from all date math.
Build your household's emergency plan
Free, and built around where you live.