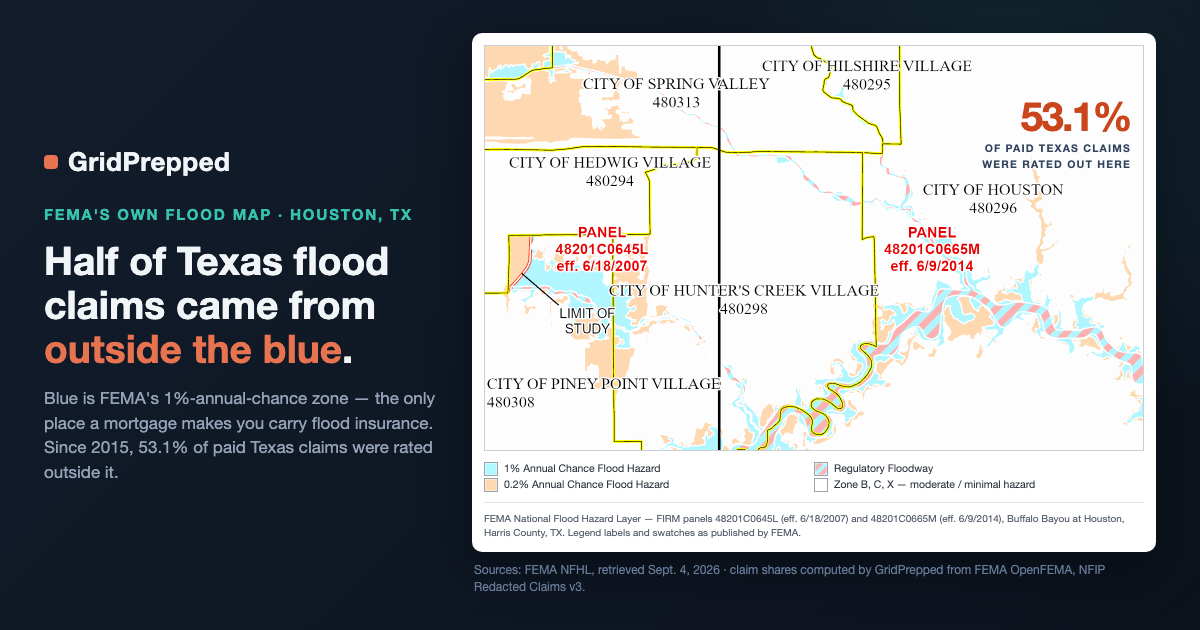
Half of Texas Flood Claims Came From Outside the Flood Zone. In Florida, 8%.
FEMA's NFIP claims file, computed by state: 27% of paid flood claims since 2015 sat outside the mapped high-risk zone. Texas 53%, Florida 8%.
Flood maps get read like a yes/no answer. You type your address into the viewer, you see "Zone X," and you stop thinking about it. So I went to FEMA's own claims file to find out how often that answer turns out to be wrong. The national number is roughly what you'd guess. The state-by-state number is not — the same map is about six times better at predicting your risk in Florida than it is in Texas.
What FEMA's claims file actually says
The NFIP Redacted Claims dataset lists every flood insurance claim the program has paid, stripped down to ZIP-level detail. I queried it directly on September 4, 2026 and windowed it to losses from 2015 onward: 482,677 paid building claims, about 24% of the 2,006,835 paid claims in the full file. Recent enough to describe the maps that are actually in force.
Of those 482,677 paid claims, 130,833 — 27.1% — were rated in Zone B, C, or X. Those are the moderate- and minimal-hazard designations. They're the zones where flood insurance is optional, where no lender makes you carry it, and where most homeowners reasonably conclude the question is settled. Better than one in four paid claims came from the part of the map that says you're probably fine. Across the entire history of the file that share is 23.9%, so the recent window runs slightly higher, not lower.
That national ratio isn't news; FEMA has cited something like it for years. The breakdown by state is the part nobody publishes, and it's the part that changes what you should do.
| State | Paid claims since 2015 | Outside high-risk zone | Share |
|---|---|---|---|
| Texas | 120,837 | 64,152 | 53.1% |
| Maryland | 2,110 | 836 | 39.6% |
| New York | 8,996 | 3,491 | 38.8% |
| Virginia | 4,686 | 1,703 | 36.3% |
| Ohio | 2,483 | 864 | 34.8% |
| California | 4,816 | 1,591 | 33.0% |
| Tennessee | 3,312 | 1,022 | 30.9% |
| Louisiana | 58,764 | 15,384 | 26.2% |
| North Carolina | 27,031 | 5,875 | 21.7% |
| New Jersey | 11,312 | 2,383 | 21.1% |
| Kentucky | 5,649 | 785 | 13.9% |
| Florida | 151,101 | 12,316 | 8.2% |
Only states with at least 2,000 paid claims in the window are shown, so these aren't small-sample artifacts. In Texas, the majority of paid flood claims since 2015 came from outside the mapped high-risk zone. In Florida, fewer than one in twelve did. Same federal program, same map standards, a 6.5x difference in what "not in a flood zone" tells you.
Why one map performs two different ways
The pattern lines up with what each state's flooding actually is. Florida's dominant flood problem is coastal — surge and tide, along shorelines that the maps study hardest and where a mortgage usually forces a policy into place. Texas's dominant flood problem is rainfall sitting on flat, paved, fast-growing metro land, where water collects wherever the drainage stops keeping up rather than inside a channel boundary drawn decades ago.
A map built around channels and coastline does well against surge. It does considerably worse against four days of rain landing on a subdivision that didn't exist when the panel was drawn.
Harvey is the clean test, and 2024 shows it wasn't a fluke
Hurricane Harvey stalled over southeast Texas in August 2017 and produced the most expensive year in the state's NFIP history: 75,741 paid building claims. 39,085 of them — 51.6% — were rated outside the high-risk zone.
Run the same query on Florida's Hurricane Ian year, 2022: 37,580 paid claims, 2,463 outside the zone, 6.6%. Two of the costliest flood events the program has ever absorbed, opposite answers to the same question.
And it isn't a hurricane artifact. Texas in 2024 — no landfalling catastrophe driving the totals — still ran 3,083 paid claims with 40.3% outside the high-risk zone.
What to do with this
Look up your zone, then read it against your state. The zone is real information; it just isn't a verdict. Our flood zone lookup gives you the designation for your address, and Harvey is the reason to treat a Zone X result as one input rather than an all-clear: in that event, more than half the people who collected on a Texas flood claim were standing where you're standing.
Decide about coverage on a dry day. Homeowners policies exclude flood, and FEMA notes a typical 30-day waiting period before an NFIP policy takes effect. That makes it one of the few readiness decisions you genuinely cannot make while the radar is on screen — which is exactly the kind of thing worth writing down once. A saved plan in your emergency plans is where the boring answers live: whether you carry flood coverage, the policy number, where the car goes, which documents leave with you.
In a rainfall state, watch the rain, not the map. Flood watches and warnings are issued off forecast rainfall and river response, not off your zone letter. Suppose you rent in Houston at a Zone X address and your parents are outside Baton Rouge — two places, two totally different triggers, and neither of them is in the other's forecast. GridPrepped alerts let you watch up to five locations, with severity set per location, so you can run your own address at "Moderate & up" and theirs at "Severe only" and still get one digest instead of two inboxes full of noise.
None of this makes flooding less likely. It does mean the sentence "we're not in a flood zone" should be the beginning of the conversation in about half the country, not the end of it.
Sources
FEMA OpenFEMA, NFIP Redacted Claims v3 (queried 2026-09-04): https://www.fema.gov/openfema-data-page/nfip-redacted-claims-v3
FEMA, Flood Insurance (30-day waiting period): https://www.fema.gov/flood-insurance
FEMA Flood Map Service Center: https://msc.fema.gov
NHC Tropical Cyclone Report, Hurricane Harvey (AL092017): https://www.nhc.noaa.gov/data/tcr/AL092017_Harvey.pdf
Build your household's emergency plan
Free, and built around where you live.