Each Hazard Has a Different Median Age. Plan for the Person, Not the House.
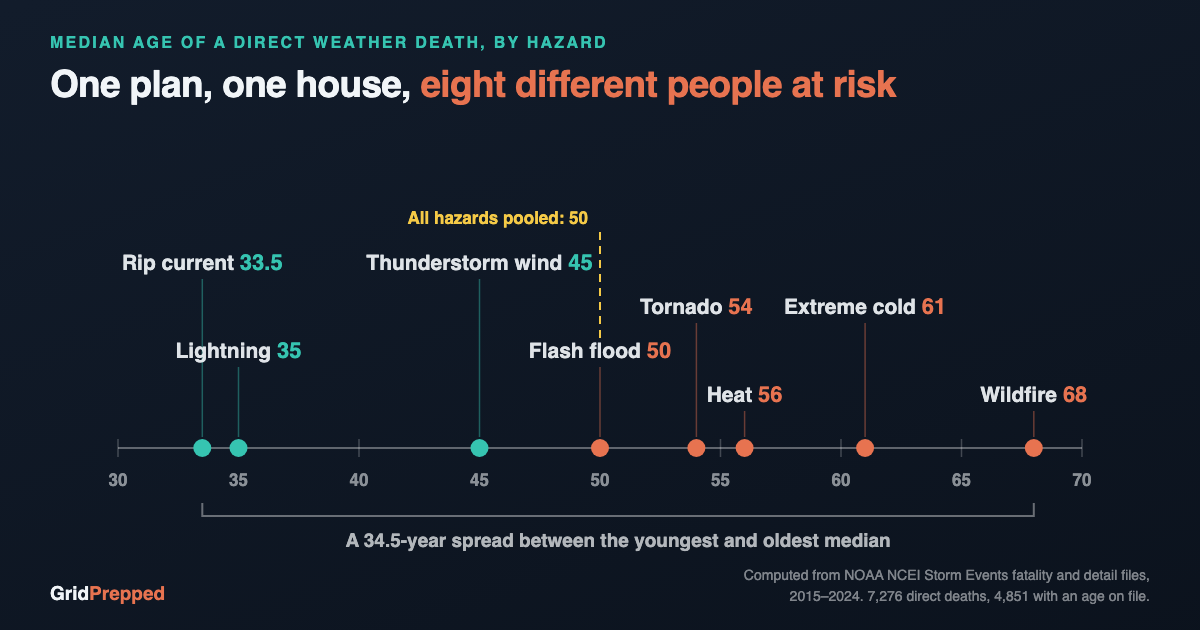
NOAA fatality records, 2015-2024: the median age of a weather death runs from 33.5 for rip currents to 68 for wildfire. Plan per person.
Most household emergency plans are written as though a household were one object. One address, one kit, one list for when the lights go out. NOAA's storm records suggest a different shape, because they log the age of the person who died.
I pulled the NOAA National Centers for Environmental Information Storm Events files for 2015 through 2024, joined the fatality records to the event records on event ID, and kept only the deaths NOAA classifies as direct. That comes to 7,276 deaths drawn from 639,467 logged storm events. An age is on file for 4,851 of them. Then I took the median age, hazard by hazard.
The median age swings 34 years
| Hazard | Direct deaths | Ages on file | Median age | Share 65+ |
|---|---|---|---|---|
| Rip current | 658 | 602 | 33.5 | 9.6% |
| Lightning | 213 | 198 | 35 | 12.1% |
| Thunderstorm wind | 325 | 281 | 45 | 21.0% |
| Flash flood | 844 | 768 | 50 | 25.0% |
| Tornado | 481 | 436 | 54 | 31.2% |
| Heat | 2,639 | 1,021 | 56 | 37.5% |
| Extreme cold | 377 | 313 | 61 | 40.9% |
| Wildfire | 329 | 186 | 68 | 57.5% |
Pooled across every hazard, the median age of a direct weather death is 50. Just over a quarter, 27.5%, were 65 or older, and 19.5% were under 25. Split by hazard, that middle moves from 33.5 years for rip currents to 68 for wildfire, a spread of almost 35 years in the same ten-year window.
Two caveats worth stating up front. Age coverage is uneven: NOAA has an age for 768 of the 844 flash flood deaths, but only 1,021 of the 2,639 heat deaths, so the heat median rests on 39% of its cases. And the window is deliberately modern. This describes the last decade, not a century of averages.
The pattern survives both caveats. At the old end sit the slow hazards that work on a body over hours or days. At the young end sit the fast ones that happen outdoors while somebody is doing something ordinary.
Where people were says the same thing twice
The same files record where each person was. Of the 455 tornado deaths with a location on file, 233 were in mobile or manufactured homes. That is 51.2%, against 133 in permanent homes. Of the 766 flash flood deaths with a location, 332 were in a vehicle (43.3%) and 170 were in the water.
Heat and cold run the other way. Only 3.6% of located extreme-cold deaths involved a vehicle, and 65.9% happened outdoors. For heat, 206 of 950 located deaths were in a permanent home.
Risk, in other words, is not distributed evenly across an address. It is distributed across people, buildings and errands.
Texas, February 2021
In Texas in February 2021, the month of Winter Storm Uri, NOAA logged 83 direct deaths across its cold and winter storm categories. Ages are on file for 61. The median was 68, thirty-three of the sixty-one were 65 or older, and the oldest was 100. Of the 44 with a recorded location, 28 died in a permanent home.
The grid failure was statewide and famous. The people it reached were mostly older, and mostly indoors, in exactly the house that any family plan would have been written around.
Give each hazard a name
Take the three or four hazards your area actually gets and write a person's name next to each one. That single exercise is what the data is asking for, and it takes ten minutes.
Say your father is 78 and lives alone two states away. Heat's median is 56, and 383 of its 1,021 known ages were 65 or older, so a heat advisory in his county deserves more of your attention than the same advisory in yours. GridPrepped's email alerts at /alerts let you watch up to five locations and set severity separately for each one: off, severe only, or moderate and up. Running his county at moderate and up while your own sits at severe only means the warning that matters reaches you, and it arrives as one grouped digest instead of five apps' worth of pings.
If anyone you love lives in a manufactured home, that 51.2% figure is most of their tornado plan. The decision it demands is a destination, and it has to be made on a clear afternoon rather than during a warning. Look up what your county actually gets at /tornado-risk, then write the destination and the trigger into a saved plan at /dashboard/emergency-plans so that on the night it counts the answer is a lookup and not an argument.
The young end of the table needs a different delivery. Of the 602 rip current deaths with a known age, 225 were under 25 and 119 were under 18, and the flash flood number is a driving rule more than a weather rule. The National Weather Service says it in four words: Turn Around, Don't Drown. The trouble is that the person who most needs those rules is rarely the person who wrote them down. Sharing a plan through /dashboard/family puts it on their phone, under their own login, before the beach trip rather than after it.
None of this makes a hazard smaller. It does make the plan more honest about who it is for. A single sheet titled "our family plan" tends to be written by the most prepared adult in the household, for the situation that adult expects to be in. The record for the last ten years says the hazard usually finds somebody else.
Build one plan per person at /plan, then check who is watching which location. It is free, and the whole thing is one evening's work.
Sources
NOAA National Centers for Environmental Information, Storm Events Database bulk CSV files (details and fatalities, 2015 through 2024): https://www.ncei.noaa.gov/pub/data/swdi/stormevents/csvfiles/
All medians, shares and location counts above were computed from those files for this article.
National Weather Service, Turn Around Don't Drown: https://www.weather.gov/safety/flood-turn-around-dont-drown
National Weather Service heat safety: https://www.weather.gov/safety/heat
Build your household's emergency plan
Free, and built around where you live.