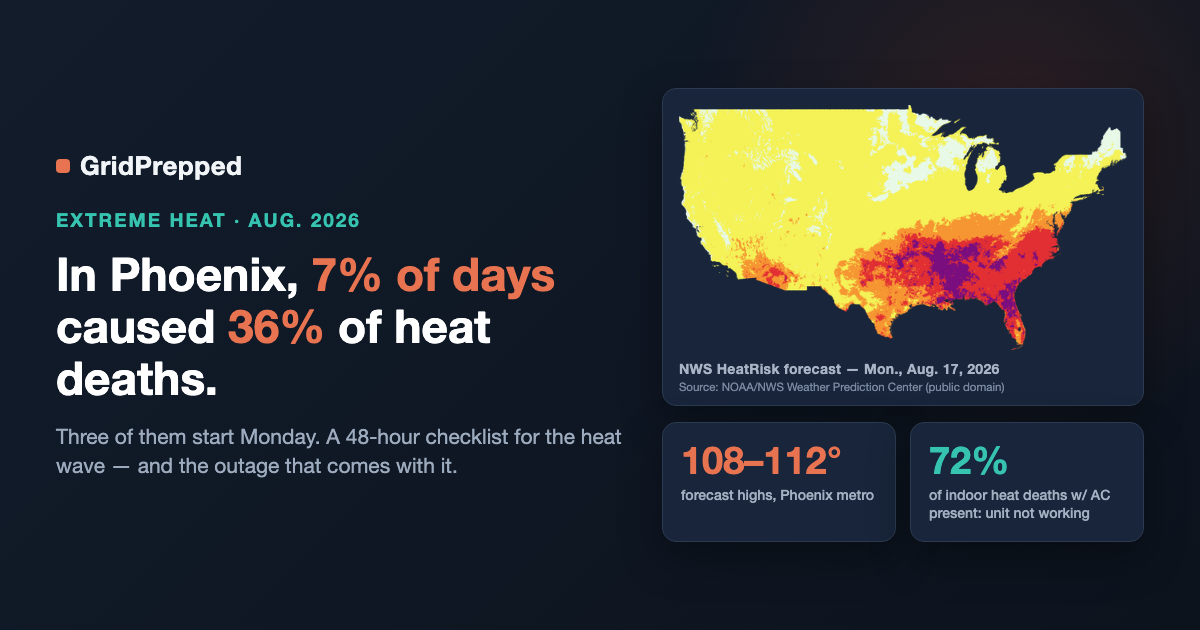
In Phoenix Last Year, 7% of the Days Caused 36% of the Heat Deaths. Three of Them Are Coming Monday.
NWS forecasts a Major HeatRisk event for Phoenix Aug 17-19. In 2025, 7% of days drove 36% of Maricopa heat deaths. A 48-hour checklist.
The National Weather Service office in Phoenix issued an Extreme Heat Watch just before midnight Wednesday. It covers the entire Phoenix metro area — Central Phoenix, Deer Valley, Scottsdale/Paradise Valley, the East and Southeast Valley, Buckeye/Avondale, Glendale, Ahwatukee, Queen Creek — from Monday morning, August 17, through Wednesday evening, August 19. Afternoon temperatures of 108 to 112. The forecast category NWS attached to it: Major HeatRisk.
That last detail is the one worth paying attention to, and almost nobody does. A single table in a county health department appendix explains why.
The number that reframes a heat wave
Maricopa County publishes one of the country's most detailed local heat-mortality datasets. Table F of the 2025 edition cross-references every heat-related death against the NWS HeatRisk category for the day it happened.
| HeatRisk category | Days | Deaths | Deaths per day |
|---|---|---|---|
| None | 109 | 2 | 0.02 |
| Minor | 160 | 70 | 0.44 |
| Moderate | 69 | 203 | 2.94 |
| Major | 22 | 109 | 4.95 |
| Extreme | 5 | 46 | 9.20 |
Major and Extreme days accounted for 27 days out of 365 — about 7% of the year. Those 27 days carried 155 of the county's 430 heat-related deaths: 36% of the annual total, roughly five times the rate you'd expect if heat killed evenly across the calendar. On a Minor day the average was 0.44 deaths; on an Extreme day, 9.2 — more than twenty times higher.
Heat mortality isn't a slow summer-long drip. It's concentrated into a handful of forecastable days, and the forecast names them days ahead.
Monday through Wednesday in Phoenix is a Major HeatRisk stretch. In 2025, that category averaged about five deaths a day in this county.
Why the forecast category beats the thermometer
HeatRisk is a 0–4 scale NWS runs with the CDC alongside its official watches and warnings. It blends how unusual the heat is for that place and date, how long it lasts, whether there's overnight relief, and what local health data says that combination does to people. A 108°F day in Phoenix in August is routine; 108°F in April is not, and HeatRisk knows the difference in a way a thermometer never will.
Level 3 — Major — is defined as affecting *anyone* without cooling or hydration, plus health systems and industries. Level 4 adds infrastructure. That's where this stops being purely a health story.
The failure mode is the air conditioner, not the weather
The same report contains the detail that should change how you prepare. Among indoor heat-related deaths in 2025, an air-conditioning unit was present in 94% of cases — and among those, the unit was not functioning in 72% of cases. In nearly three-quarters of indoor heat deaths where AC existed, the equipment was there and not working. The county sorts the reasons into three buckets: non-functioning, functioning but turned off, and no electricity.
That third bucket is our territory. A heat wave is exactly when the grid is under maximum stress — air conditioners drive demand to its annual peak while high ambient temperatures cut the efficiency of generation and transmission equipment. NERC's 2026 Summer Reliability Assessment named extreme heat the primary threat to system reliability across North America this summer, while noting record resource additions have improved reserves overall. During July's heat wave, Northeast utilities asked customers to set thermostats to 78°F and delay running appliances.
So the realistic bad Monday isn't "it got hot." It's "it got hot, demand peaked, something tripped, and the AC that was going to hold this house at 80 stopped moving air for six hours." Two more numbers from the same report: 90% of indoor heat deaths were people 50 or older, and 48% were found during a welfare check — someone came looking.
A 48-hour heat wave checklist
The Phoenix event starts Monday morning. Roughly this order:
Test the AC under load now, not Monday. Run it hard on the coldest setting today, while HVAC companies still answer the phone and can still get parts — every service tech in the Valley is booked solid by the first afternoon of a Major stretch. Replace the filter, clear debris off the outdoor condenser. A system that's been marginal all summer fails on the hottest day, not a mild one. That's what the 72% figure describes.
Pre-cool the house. Overnight and early Monday, get the interior as cold as is comfortable and affordable, then close the sun-side blinds and leave them closed. Thermal mass is free storage: a house pulled to 72°F at 7 a.m. buys hours of tolerable temperature if cooling drops mid-afternoon. A house sitting at 80°F when the outage starts buys almost nothing.
Stage water and electrolytes for three days, not three hours. Assume the tap works but the fridge and ice maker don't. Room-temperature water you already own beats cold water you have to drive for. Add something with sodium and potassium — sports drinks or oral rehydration mix — since plain water alone isn't the whole picture in a multi-day event.
Plan for the outage, not just the temperature. Charge phones and power banks Sunday night, top them off nightly, and learn how your garage door opens manually. If anyone depends on powered medical equipment — oxygen concentrator, CPAP, refrigerated medication — solve that first, and call your utility about its medical-priority list.
Pick your cooling destination before you need it. A mall, a library, a relative with better AC, or an official cooling center — in Maricopa County, 2-1-1 connects you to free cooling centers, transportation, and water. Decide now where you'd go at 3 p.m. Tuesday if the house hits 88 degrees.
Check the two neighbors who won't ask. That 48% welfare-check number is the most actionable statistic in the report. The people who die indoors in heat waves here are disproportionately over 50, often living alone, and frequently found only because somebody went to look. Text two of them Sunday, then knock Tuesday afternoon — the hottest part of the worst day — instead of texting again. An adult who's confused, unusually quiet, or has stopped sweating in a hot house needs help immediately; heat stroke is a 911 call, not wait-and-see.
This is not only a Phoenix problem this week
While Phoenix waits on Monday, a heat dome is already parked on the central US. On Thursday, August 13, NWS offices had Extreme Heat Warnings posted across Missouri, Illinois, Arkansas, Kansas, Oklahoma, Kentucky, Indiana, and Mississippi — heat index values up to 113°F, with warnings running through the weekend. NWS Springfield flagged the part people underestimate: overnight lows only reaching the upper 70s and low 80s. Missing overnight recovery is what pushes a HeatRisk category up, and what makes day three worse than day one.
If you're in that footprint, your Major-category days are happening right now, not Monday.
Where GridPrepped fits
The Maricopa data makes an unusually clean argument for alerting. If 7% of days drive 36% of deaths, and NWS publishes which days those are up to a week ahead, the whole problem reduces to whether that forecast reaches you while you can still act on it. Set your ZIP once in /alerts and extreme-heat watches and warnings for your area land on your phone — ideally Wednesday-night-for-Monday, the way this Phoenix watch went out, rather than after the house is already 90 degrees.
And because a heat wave is a grid event as much as a weather event, /plan sizes the household side: water for the actual number of days and people, medication and refrigeration, backup power for what genuinely can't lose it. Extreme heat and multi-day outages aren't separate scenarios. They tend to arrive together.
Several days of lead time on a Major HeatRisk event is a real advantage. Worth spending an hour of it.
---
Sources
- National Weather Service Phoenix, AZ — Extreme Heat Watch for the Phoenix metropolitan area, issued August 12, 2026, valid August 17–19, 2026 (retrieved from the NWS public alerts API, https://api.weather.gov/alerts/active?area=AZ)
- NWS St. Louis, MO and NWS Springfield, MO — Extreme Heat Warnings, issued August 13, 2026 (https://api.weather.gov/alerts/active?event=Extreme+Heat+Warning)
- Maricopa County Department of Public Health, *2025 Heat-Related Deaths Report*, April 2026 — Table A, Table B, Table F, Table H, Table I, and Indoor Heat-Related Deaths section: https://www.maricopa.gov/ArchiveCenter/ViewFile/Item/6510
- NWS HeatRisk — category definitions and CDC collaboration: https://www.wpc.ncep.noaa.gov/heatrisk/
- North American Electric Reliability Corporation, *2026 Summer Reliability Assessment Snapshot*: https://www.nerc.com/globalassets/our-work/assessments/2026-summer-reliability-assessment-snapshot.pdf
- Maricopa County heat relief information and cooling centers (2-1-1): https://www.maricopa.gov/heat
- CNBC, "Extreme heat wave threatens U.S. power grids and July 4 travel" (July 3, 2026): https://www.cnbc.com/2026/07/03/extreme-heat-us-power-grids-july-4-travel.html
Build your household's emergency plan
Free, and built around where you live.