How to Find Out Which Disasters Are Likely Where You Live
Find which disasters are likely where you live: FEMA's risk index, your flood zone, drought and air quality, and what each box on a threats page means.
The short answer
Start with FEMA's free National Risk Index. It rates 18 natural hazards for every U.S. county, from "Very Low" to "Very High." Then add three lookups the index does not cover: your flood zone on FEMA's Flood Map Service Center, current drought on the U.S. Drought Monitor, and your water system's annual Consumer Confidence Report. With those four you know which hazards your county has, which ones are active right now, and where your own address sits.
All of it is free and published by public agencies, spread across a dozen different sites. Below is how to read each piece, followed by a walkthrough of GridPrepped's Grid Threats page, which pulls most of it into one screen for your ZIP code.
What does the National Risk Index actually tell me?
The NRI is FEMA's county-by-county estimate of how much each natural hazard is expected to cost a place, adjusted for how vulnerable and how resilient the community is. Ratings run on five steps: Very Low, Relatively Low, Relatively Moderate, Relatively High, Very High.
"Relatively" means compared with other counties, so "Relatively Low" is not the same as "no risk." And it is a long-run picture built from historical data, not a forecast. It tells you which hazards to plan for, not when they will show up.
Is my house in a flood zone?
Type your address into the Flood Map Service Center. Zones starting with A or V are Special Flood Hazard Areas, the places FEMA's maps show a 1% or greater chance of flooding in any year. If your mortgage is from a federally regulated or insured lender, which covers most mortgages, flood insurance is required for buildings in those zones. Zone X means moderate to low mapped risk. It does not mean no risk, so a basement in Zone X can still take water.
What about things that change week to week?
Some hazards are seasonal or live, and a static rating will not show them:
| Hazard | Free public source | How often it updates |
|---|---|---|
| Drought | U.S. Drought Monitor | Weekly |
| River and coastal flooding | NOAA National Water Prediction Service | Every few minutes to hourly |
| Wildfire and smoke | NASA FIRMS, AirNow | Several times a day |
| Space weather | NOAA Space Weather Prediction Center | Continuously |
| Severe weather | National Weather Service alerts | As issued |
Step 1: Open Grid Threats
GridPrepped's Grid Threats page sits behind a free account and starts from the ZIP on your profile. Sign in and go to gridprepped.com/dashboard/threats. Everything on the page is free.
At the top is a Check zip box. Type any ZIP and press Go to look somewhere else, such as a parent's town or a place you are thinking of moving. Typed ZIPs are not saved. The My location button (a crosshair icon on phones) shows threats for where your browser is right now. It is not saved either, and the page returns to your profile ZIP when you reload or leave.
Step 2: The risk summary and the hazard list
The Risk Summary shows how many hazards the page lists for your state and how many are high-risk. A hazard counts as high-risk when it is rated Very High or Relatively High.
The hazard list, further down, has one card per hazard, sorted from highest rating to lowest. Open a card and you get preparation tips, a "Ready.gov Recommends" list of supplies and goals, and a link to the matching Ready.gov page.
Be clear on what these ratings are. They are state-level ratings from FEMA's National Risk Index, so every ZIP in your state gets the same badges. Your county can be very different from the state as a whole. A mountain county and a river-delta county in the same state rarely share a flood profile. For county detail, open the NRI itself and search your county.
Each hazard card also has Go to Supply Tracker and Go to Readiness Goals buttons. If Winter Weather shows up as Relatively High, the useful next move is to add the items from that card to your supply tracker, which keeps expiration dates so the batteries and water you bought in October are still good in January.
Step 3: Federal disaster history
This card is marked Statewide for a reason. It counts recent FEMA disaster declarations across your state: the total, how many came in the last 10 years, the five most common types, and the five most recent declarations, each linking to its page on fema.gov. In states with many counties, the lookup only reaches back a few years, so read the total and the 10-year count as "at least this many." For the full record, search FEMA's declarations page.
Read it as "what kinds of disasters this state gets declared for," not "what has hit my street." The page itself notes that some declarations may be hundreds of miles from your ZIP.
Step 4: Flood zone, hazard facilities, and nuclear plants
Distances on this page are measured from the center of the ZIP code, not your front door.
FEMA Flood Zone pulls your zone from FEMA's flood hazard layer. If you have saved a street address, it checks that address. Otherwise it uses the center of your ZIP code, which can land in a different zone from your house. When you are looking at a ZIP other than your own, the flood card still shows the zone for your saved address, so use the Flood Map Service Center for anyone else's. A result in a high-risk zone is marked "High Risk (SFHA)" with a note that flood insurance is federally required for mortgages there. If you see no zone, or anything that matters for a purchase or insurance decision, confirm it at the Flood Map Service Center. The card links there.
Hazard Facilities counts sites that report to the EPA's Risk Management Program, meaning facilities that hold more than a set amount of certain toxic or flammable chemicals, within 1 mile, 1 to 5 miles, and 5 to 15 miles, and lists the five nearest. If one is within a mile, it suggests planning for a chemical release and knowing how to shelter in place.
Nuclear Plant Proximity only appears if a commercial reactor is within 50 miles. It shows the distance to the nearest one and lists up to four. Inside about 10 miles you are likely in the plant's Emergency Planning Zone, where local plans cover things like potassium iodide and evacuation routes. Your county emergency office can confirm. Inside 50 miles is the ingestion pathway zone, which is mostly about food and water after a release. This is a distance from a list of plant locations, not a live NRC feed.
Step 5: Drought, drinking water, and space weather
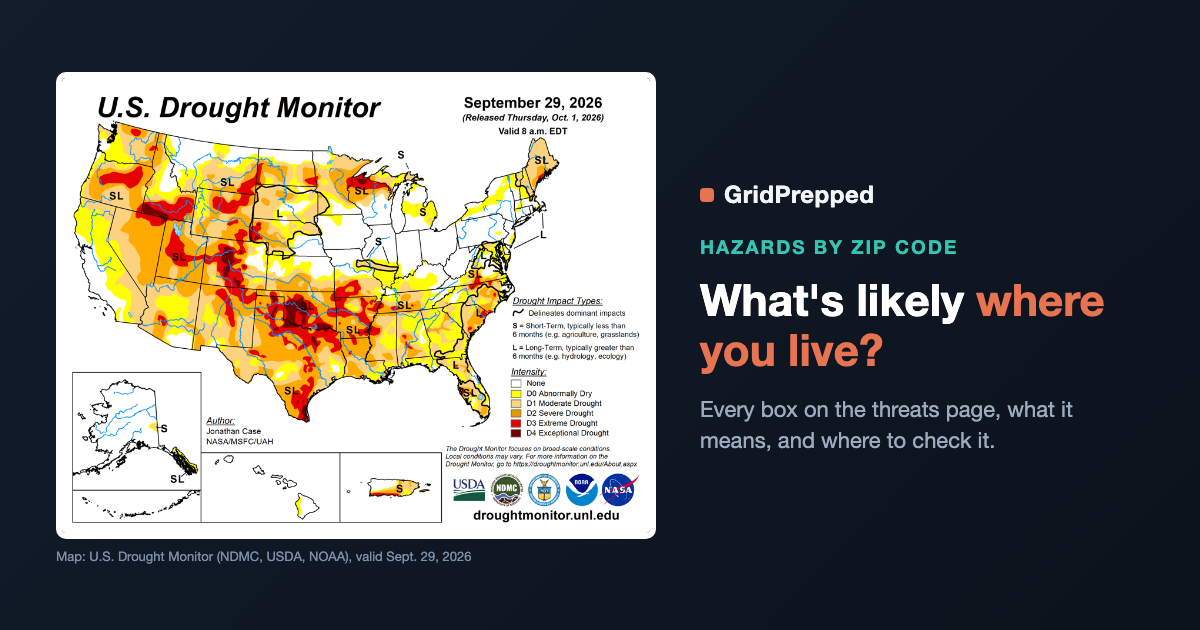
Drought Conditions shows recent U.S. Drought Monitor data for your county as bars from None through D0 (abnormally dry) to D4 (exceptional), labeled with the week it covers. Check that date: the Drought Monitor publishes a new map every Thursday, and its site always has the latest. Each bar shows the share of the county at that level or worse. The headline label shows the worst category that touches any part of your county, so 1% of the county in D4 still reads "Exceptional."
Drinking Water Quality summarizes EPA records for community water systems in your ZIP. Your utility's annual Consumer Confidence Report is the authoritative source for your own tap, so check it either way. If you are on a private well you won't get one, and testing is up to you.
Space Weather shows the planetary Kp index from NOAA, a 0 to 9 measure of geomagnetic activity. 5 and up is a geomagnetic storm: G1 (minor) at 5, up to G5 (extreme) at 9. Strong storms can affect power grids, GPS and radio, which is why it is on a grid page. The alert number counts every space-weather alert, watch and warning NOAA has issued worldwide over about the past month, so a big number does not mean a storm right now. The Kp reading is the one to watch.
Step 6: Live water, fire and smoke
Water Threat refreshes at most every 15 minutes when you open or return to the page. It shows your nearest stream gauge against the National Weather Service flood categories: action stage first, then minor, moderate and major flooding. Action stage means the river is high enough that people who manage it start preparing. It is not yet a flood. You may also see a nearby reservoir, a tide station within 50 miles, and any active tropical system within 1,500 miles. A storm on that list is there because of distance, and it is not a forecast that it will reach you. Each reading links to its NOAA or USGS page.
Fire & Smoke appears when there is something to show. It lists satellite fire detections from NASA within 100 miles in the last day, current PM2.5 and ozone readings using AirNow's category names, and the air quality forecast for today and tomorrow. A detection is a hot spot seen from orbit. It can be a factory flare or a planned burn, so check the FIRMS map before you worry. If you have anyone in the house with asthma or heart trouble, the forecast is the line worth watching.
Step 7: Resources near you and your county's plan
Resources Near You lists the nearest hospital, fire station, police station, EMS station and school within 15 miles, with distance and, where listed, a phone number you can tap to call. The page suggests printing it, and that is good advice. During a long outage the cell network may be down, and a printed list on the fridge still works.
Your County's Hazard Mitigation Plan opens a search for your county's plan, which counties update roughly every five years. The risk assessment chapter is usually the most local hazard analysis available, written by people who know which roads flood.
What should I do with all this?
Pick your top two or three hazards and plan for those first. The plans overlap more than you would think: water, light, medications and a way to get news cover most of them.
Then think past your own ZIP. A useful thing to do on this page is to type in the ZIP of the place your kid goes to college, or where a parent lives alone, and see what is high-risk there. It is often a different list from yours. Once you know, GridPrepped's alerts can watch up to five locations, each with its own setting: off, severe only, or moderate and up. One digest email covers all of them, and you set them up under Locations on your profile page. Your own ZIP on moderate and a campus 900 miles away on severe only is a reasonable setup.
The short version
1. Check FEMA's National Risk Index for your county.
2. Look up your exact address on the Flood Map Service Center.
3. Open Grid Threats and check your ZIP, plus anyone you would want to know about.
4. Treat the hazard badges and disaster history as statewide, and the flood, drought, fire and facility cards as local to the ZIP.
5. Confirm anything that affects money or health at the official source.
6. Plan for your top two or three hazards.
Want to start without an account? Build a plan for your household first. It works without signing in.
Sources
FEMA National Risk Index: https://hazards.fema.gov/nri
FEMA Flood Map Service Center: https://msc.fema.gov/portal/search
OpenFEMA Disaster Declarations Summaries: https://www.fema.gov/openfema-data-page/disaster-declarations-summaries-v2
U.S. Drought Monitor: https://droughtmonitor.unl.edu/
EPA Risk Management Program: https://www.epa.gov/rmp
EPA Consumer Confidence Reports: https://www.epa.gov/ccr
NOAA Space Weather Scales: https://www.swpc.noaa.gov/noaa-scales-explanation
NOAA National Water Prediction Service: https://water.noaa.gov/
NASA FIRMS: https://firms.modaps.eosdis.nasa.gov/
AirNow: https://www.airnow.gov/
NRC Emergency Planning Zones: https://www.nrc.gov/about-nrc/emerg-preparedness/about-emerg-preparedness/planning-zones.html
Ready.gov: https://www.ready.gov/
Build your household's emergency plan
Free, and built around where you live.