The Average American Lost 11 Hours of Power in 2024. In South Carolina, It Was 53.
EIA's 2024 data: the average US customer lost 11 hours to blackouts — almost double the decade norm. Here's what drove it.
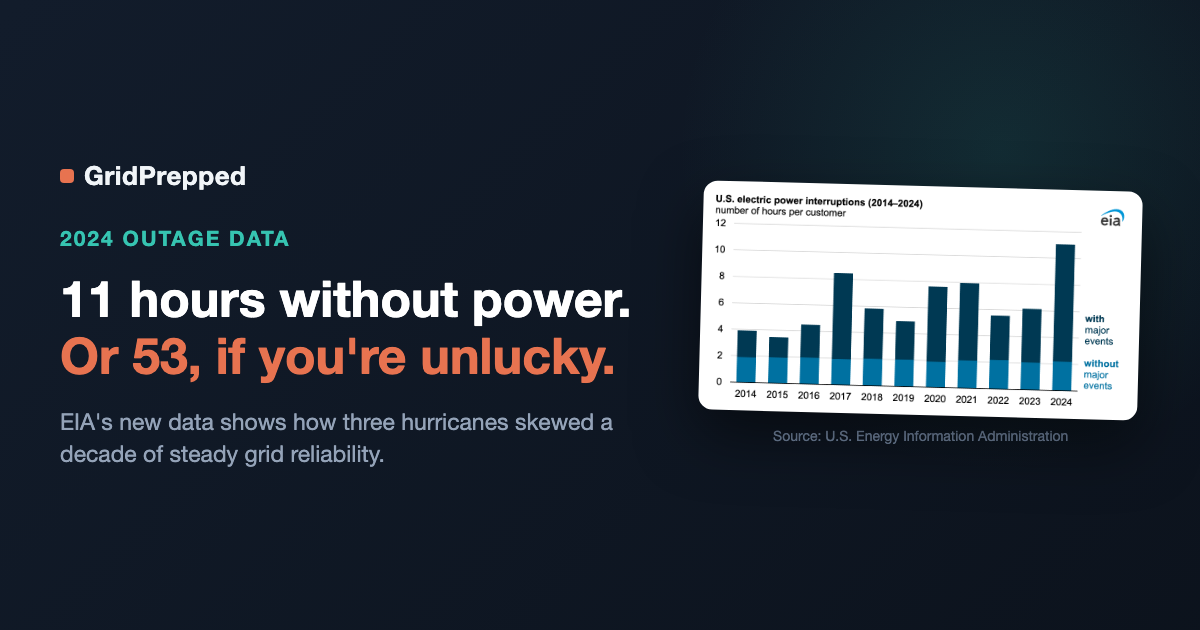
If your power flickered out for a few hours sometime in the last year, you weren't imagining a trend. The U.S. Energy Information Administration's most recent Electric Power Annual puts a number on it: the average American electricity customer went without power for about 11 hours in 2024 — nearly double the roughly 6-hour average of the decade before it. (2024 is the most recent year with complete federal reliability data — EIA's state-level numbers lag about a year, so the 2025 edition won't be out until late 2026.) And the number that matters more than the average is *why* it moved.
Three storms did 80% of the damage
EIA's breakdown is blunt about the cause. Utilities split outage time into two buckets: "major event" interruptions (named storms, ice storms, wildfires — the stuff that overwhelms normal repair crews) and everything else (tree limbs, squirrels, routine equipment failures). In 2024, major events accounted for nearly 9 of the average customer's 11 outage-hours — that's 80% of all the dark time in the country traced to a handful of events. Hurricanes Beryl, Helene, and Milton did most of that work.
Here's the part that should reframe how you think about "normal" outage risk: non-major-event interruptions — the boring stuff, tree branches and blown transformers — have held steady at about 2 hours per year for a decade. That number barely moves. What moves the average is a single bad storm season landing on the wrong states. 2024 wasn't an unusually outage-prone *baseline* year. It was an unusually storm-hit year, full stop, and the data shows the difference in stark terms: routine outages average 2 hours a year; a bad storm year can push the total past 50.
South Carolina had it worst — by a lot
EIA's state-level reliability tables (SAIDI — System Average Interruption Duration Index) show just how uneven that 11-hour national average really is. South Carolina customers averaged nearly 53 hours without power in 2024, the highest of any state and roughly 5x the national figure. North Carolina and Georgia weren't far behind, both well over triple the U.S. average. Meanwhile customers in Arizona, the Dakotas, and Massachusetts averaged under 2 hours all year.
That's not a coincidence of geography — it's Hurricane Helene. Helene made landfall in Florida in late September 2024 and, per EIA and utility restoration reports, ultimately knocked out power to 5.9 million customers across 10 states, with more than a million of those in South Carolina alone. Dominion Energy's own outage log for the storm shows peak outages hitting 386,270 customers in its South Carolina territory, with full restoration in the hardest-hit upstate counties taking the better part of two weeks — some co-ops described it as less a repair job than a full rebuild of the electric system. A month later, Hurricane Milton added another 3.4 million outages in Florida. In July, Hurricane Beryl had already knocked out power to 2.6 million Texas customers.
Add it up and three storms, in three states, in three months, generated most of a year's worth of national outage-hours.
The takeaway isn't "move to Arizona"
The useful lesson from this data isn't which states are safe — it's that outage risk doesn't arrive evenly, and averages hide the real exposure. If you live somewhere that's had a quiet outage decade, this data is a reminder that the risk isn't zero, it's just concentrated into rare, severe events instead of spread out. When your bad year comes, it doesn't look like 11 hours. For a lot of South Carolinians in 2024, it looked like restoration timelines measured in days, sometimes closer to two weeks in the hardest-hit counties.
That gap between "average annual outage time" and "what actually happens when the big one hits your area" is exactly where most households get caught flat-footed. A generator, a stocked pantry, and a full tank of gas mean very little if you didn't know they'd be needed until the storm was already on top of you — and mean a lot if you had even a few days' notice.
Where GridPrepped fits
This is the gap GridPrepped's /plan tool is built to close before it becomes a 2 a.m. scramble: it walks you through what a multi-day outage actually requires for your household — water, food, medication refills, backup power — sized to how many people and days you're planning for, not a generic checklist. And /alerts keeps you from finding out about the storm the same way South Carolina found out about Helene: after it's already inland. Set your ZIP once, and watches and warnings for your area show up before the outage clock starts, not during it.
None of this changes the odds that a major storm hits your specific address in any given year — that's still mostly a function of geography and luck. What it can change is whether you're using the 24-48 hours you typically get beforehand to prepare, or losing that window because nobody told you it applied to you.
One thing worth doing this week
If you're in a Gulf or Atlantic state — coastal or inland — pull up your own state's numbers in EIA's reliability tables. If your state logged a rough 2024, that's not last year's problem; storm patterns tend to repeat, and hurricane season is still running. A few minutes building an outage plan now costs a lot less than figuring it out by flashlight.
Sources
- U.S. Energy Information Administration, "Hurricanes in 2024 led to the most hours without power in the United States in 10 years" (Today in Energy, Dec. 1, 2025): https://www.eia.gov/todayinenergy/detail.php?id=66744
- U.S. Energy Information Administration, Electric Power Annual 2024, Table 11.4 (SAIDI values by state, 2014–2024): https://www.eia.gov/electricity/annual/table.php?t=epa_11_04.html
- U.S. Energy Information Administration, Electric Power Annual 2024 (full report): https://www.eia.gov/electricity/annual/
- Dominion Energy South Carolina, Hurricane Helene outage and restoration updates: https://www.dominionenergy.com/en/South-Carolina/Updates/Hurricane-Helene
Build your household's emergency plan
Free, and built around where you live.