Hurricane Lala Is Stronger Today Than When It Hit Hawaii. Nobody Is Watching It Now.
Lala peaked as a Category 4 three days after leaving Hawaii. NOAA's own records show most US landfalls arrive weaker than the headline number.
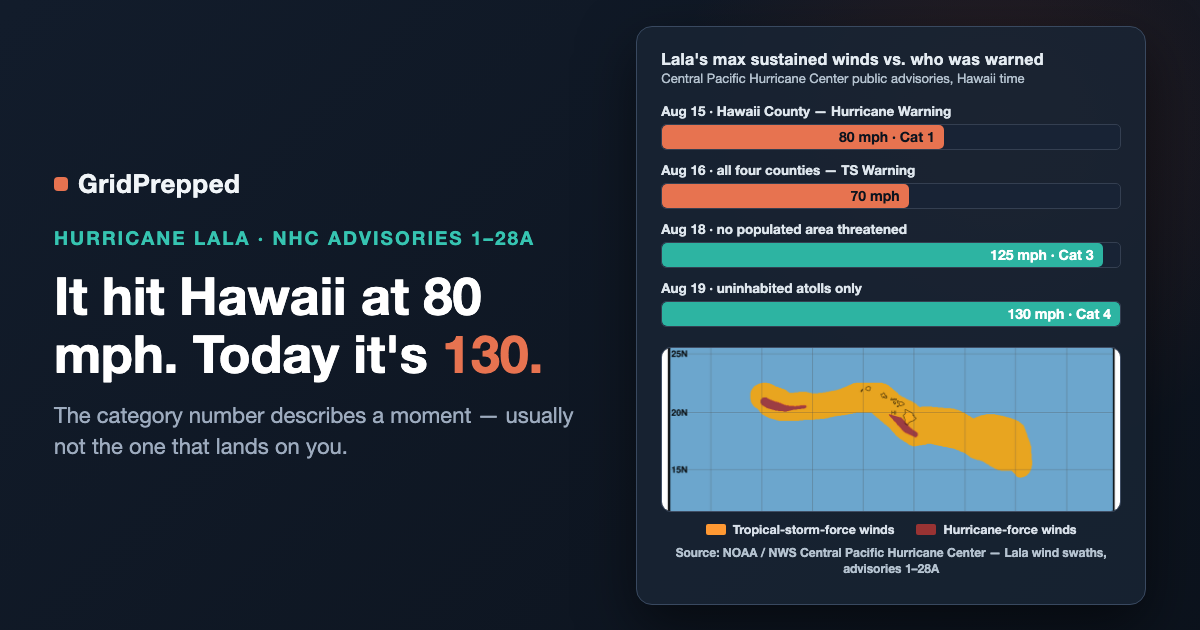
At 2:00 a.m. Hawaii time this morning, Hurricane Lala was a Category 3 with 125 mph sustained winds. Overnight it touched 130 mph — Category 4. That is the strongest Lala has ever been, and it is very close to the least dangerous Lala has ever been.
The hurricane warnings in effect right now cover the Papahānaumokuākea Marine National Monument, from Lisianski Island to Maro Reef. There are no towns out there. The storm is 300 miles south of a coral atoll, spinning up to its lifetime peak over open Pacific.
Four days ago, when Lala actually mattered to people, it was an 80 mph Category 1.
That is the entire lesson of this storm, and it is worth sitting with, because the number most of us use to decide how seriously to take a hurricane is a number that describes a specific moment — often not the moment that lands on us.
Lala's intensity peaked three days after its impact peaked
Pulled straight from the Central Pacific Hurricane Center's public advisory archive:
| Advisory (Hawaii time) | Status | Max sustained winds | Who was under a warning |
|---|---|---|---|
| Aug 15, 11:00 AM | Hurricane | 75 mph | Hawaii County — Hurricane Warning |
| Aug 15, 5:00 PM | Hurricane | 80 mph | Hawaii County — Hurricane Warning |
| Aug 16, 5:00 AM | Tropical Storm | 70 mph | All four counties — TS Warning |
| Aug 17, 5:00 PM | Tropical Storm | 70 mph | None |
| Aug 18, 5:00 PM | Category 3 | 125 mph | Uninhabited atolls |
| Aug 18, 11:00 PM | Category 4 | 130 mph | Uninhabited atolls |
Lala gained 60 mph in the 30 hours after it stopped threatening anyone.
Meanwhile, the version of Lala that was "only" a Category 1 knocked out more than 250,900 Hawaiian Electric customers at peak across three islands, and prompted the utility to warn that the hardest-hit rural parts of Hawaii Island should prepare for outages lasting weeks or even months.
An 80 mph storm produced a multi-week outage. A 130 mph storm produced a press release nobody read.
NOAA's records say this is normal, not a fluke
I ran the numbers on NOAA's HURDAT2 database — the official Atlantic hurricane record, 1851 through 2025 — comparing every storm's *lifetime peak* intensity against its strongest *US landfall* intensity.
For the 173 storms that made a US landfall since 1980:
- 61% came ashore weaker than their lifetime peak.
- 36% came ashore in a lower Saffir-Simpson category than the one they had earned at sea.
- Of the 51 storms that peaked as major hurricanes (Category 3+), 20 — about 39% — made US landfall below major hurricane strength.
The average storm gave up about 13 knots between its best day and its landfall. Some gave up far more. Hurricane Florence peaked at 150 mph and came ashore in North Carolina at 90 mph. Hurricane Milton peaked at 180 mph and landed at 115.
Here's the part that matters for planning: none of those storms became harmless on the way down. Florence's headline was a downgrade. Its legacy was catastrophic freshwater flooding.
The scale tells you it isn't the whole story
This isn't a criticism of the Saffir-Simpson scale. The National Hurricane Center is unusually blunt about its limits, in writing, on its own explainer page:
> "This scale does not take into account other potentially deadly hazards such as storm surge, rainfall flooding, and tornadoes."
It's a wind scale. It estimates potential *property* damage from wind, at one instant, at the storm's core. It says nothing about how much water is coming, how long the rain sits over your watershed, or how many days your utility needs to re-string the line to your neighborhood.
And water is where the risk concentrates. NHC's storm surge program notes that surge alone "directly accounts for about half of the deaths associated with tropical cyclones in the United States." Add rainfall flooding and the water share of tropical cyclone deaths climbs well past that. The wind number gets the headline; the water does most of the damage.
Beryl ran the same play in reverse
If Lala shows a storm peaking where nobody lives, Hurricane Beryl in July 2024 shows the opposite — and it's the more useful case, because the category number was *reassuring* and wrong.
Per the NHC's official Beryl report, Beryl became the earliest Category 5 hurricane on record in the Atlantic, peaking at 165 mph. By the time its center reached Matagorda, Texas, it had been beaten down to 90 mph — a Category 1.
A Category 1 landfall. And then, from the same report: nearly 3 million customers lost power, 2.7 million of them in southeastern Texas. Houston sat in July heat for days; more than a million customers were still out three days later, and tens of thousands were dark a full week after the storm. Beryl was directly responsible for 35 deaths.
Nobody plans for two weeks without air conditioning when the news says "Category 1." That gap between the number and the experience is where households get hurt.
What to actually track instead
The category is a useful shorthand for the storm. It is a poor input for your household. A few substitutions that work better:
Track the warning for your location, not the number for the storm. A Hurricane Warning for your county is a decision trigger. A Category 4 six hundred miles away is trivia. Lala carried hurricane-force winds only 30 miles from its center — but tropical-storm-force winds out to 115 miles. Most people affected by a hurricane never experience the category on the label.
Plan in days-without-power, not miles-per-hour. Beryl's wind was Category 1. Its outage was Category "week." Those are independent variables, and only one of them shows up in the forecast.
Assume the water is the problem. If your address floods, it floods at Category 1 and Category 5. Know whether you're in a surge or flood zone before a storm has a name.
Expect the forecast to move. Lala went 70 to 130 mph in about a day. Rapid intensification cuts both ways, and a storm that looks manageable at the 5:00 p.m. advisory can look different at 11:00.
This is roughly why GridPrepped's alerts watch NWS and NHC products for a specific location rather than pushing storm headlines — a warning for your county reaches you on its own schedule, not the news cycle's. And the plan builder is organized around duration instead of intensity: how many days of water, which medications need refrigeration, who checks on whom. None of those answers change based on the Saffir-Simpson number, which is exactly the point.
If you do one thing today: look up whether your address sits in a flood or storm-surge zone. It's a five-minute question on a calm Wednesday, and it's the input the category number will never give you.
---
Sources
Central Pacific Hurricane Center / National Hurricane Center, Hurricane Lala public advisory archive, advisories 1–28 and intermediate advisory 28A, Aug. 12–19, 2026 (intensity timeline, watches and warnings, wind radii)
https://www.nhc.noaa.gov/archive/2026/cp01/
Central Pacific Hurricane Center, Hurricane Lala Intermediate Advisory 28A, 200 AM HST Aug. 19, 2026
https://www.nhc.noaa.gov/text/HFOTCPCP2.shtml
NOAA / National Hurricane Center, HURDAT2 Atlantic hurricane database, 1851–2025 (revision 02-27-2026); lifetime-peak vs. US-landfall intensity comparison computed by GridPrepped
https://www.nhc.noaa.gov/data/hurdat/hurdat2-1851-2025-02272026.txt
National Hurricane Center, Saffir-Simpson Hurricane Wind Scale
https://www.nhc.noaa.gov/aboutsshws.php
National Hurricane Center, Potential Storm Surge Flooding Map (storm surge share of US tropical cyclone deaths; Rappaport, 2014)
https://www.nhc.noaa.gov/surge/inundation/
National Hurricane Center, Tropical Cyclone Report: Hurricane Beryl (AL022024) — landfall intensity, power outage totals, fatalities
https://www.nhc.noaa.gov/data/tcr/AL022024_Beryl.pdf
Hawaiian Electric, Tropical Storm Lala restoration updates, Aug. 15–16, 2026 (peak outage counts; extended-outage guidance for rural Hawaii Island)
https://www.hawaiianelectric.com/about-us/newsroom
Build your household's emergency plan
Free, and built around where you live.